Because “growth” is NOT a strategy. It’s an outcome of EXECUTION.
If you run a media brand, an event franchise, a marketplace, or a membership community, you already know the uncomfortable truth. You’re not operating one revenue engine. You’re orchestrating multiple. Multiple buyer types. Multiple value exchanges. Multiple unit economics. Multiple ways to accidentally set money on fire while your dashboard tells you everything is “fine.”
In 2026, the companies that win won’t be the ones with the most data. They’ll be the ones with the cleanest control panel and the discipline to act on what it says.
This isn’t “more dashboards.” This is fewer, sharper KPIs with clear owners, clear decision paths, and a clear link to profit and enterprise value.
Here are the 10 I’m putting at the top of the list for CEOs and revenue leaders this year.
1) Net Revenue Retention (NRR)
Definition
NRR measures how much revenue you retain and expand from your existing customers over a period of time, including upgrades and expansions, minus downgrades and churn.
Formula (simplified): (Starting revenue + expansion . contraction . churn) ÷ starting revenue
Where the data comes from
- CRM (opportunities, renewals, expansion deals)
- Billing/subscription system (invoices, renewals, downgrades)
- Finance/GL for reconciliation
- Customer Success platform (health, renewals risk)
Who needs to be looking
CEO, CRO/CCO, CFO, Head of Customer Success, RevOps
Decisions based on insights
- NRR up: invest more in expansion plays. Build packaging that makes “next best product” obvious. Staff CS for growth, not just support.
- NRR down: stop pretending this is a “sales problem.” Fix onboarding, product value delivery, account plans, pricing leakage, and renewal process. Your easiest growth is inside the base, unless you’ve trained customers to leave.
2) Gross Margin by Revenue Stream (and by segment)
Definition
Gross margin is revenue minus direct cost to deliver that revenue, expressed as a percent. In multi-sided models, it must be broken down by stream (events, sponsorship, ads, subscriptions, data products, membership, services) and by segment.
Where the data comes from
- Finance system/GL (COGS allocations)
- Event P&Ls (venue, production, catering, contractor labor)
- Ad ops and fulfillment costs
- Data delivery and platform costs
- Payroll allocations for delivery roles
Who needs to be looking
CEO, CFO, COO, CRO/CCO, business unit leaders
Decisions based on insights
- Margin up: double down on the streams that scale profitably. Protect pricing. Build capacity where margins are strongest.
- Margin down: either raise prices, redesign delivery, or stop selling what you can’t deliver profitably. “Revenue growth” that drags margin is just a more expensive treadmill.
3) Revenue Concentration Risk
Definition
Measures dependency on a small set of customers, categories, or partners. Typically: % of revenue from top 10 customers, plus exposure by vertical/category.
Where the data comes from
- Billing/ERP (customer revenue by period)
- CRM (pipeline by account and category)
- Sponsorship and exhibitor revenue by tier
- Marketplace data (GMV concentration by seller/buyer)
Who needs to be looking
CEO, CFO, CRO/CCO, Head of Sales, Strategy/Corp Dev
Decisions based on insights
- Risk improving (less concentrated): you have leverage. Broaden pricing and packages. Reduce custom work.
- Risk worsening: build a diversification plan now, not after your biggest customer “pauses spend.” Tighten contracts. Create mid-market offers. Expand categories and buyer types deliberately.
4) Pipeline Coverage (Next 90 Days) and Pipeline Quality
Definition
Pipeline coverage is pipeline value relative to bookings target for a future period. Quality means how much of that pipeline is real: stage integrity, close probability, time-in-stage, and win rate by segment.
Where the data comes from
- CRM (pipeline stages, close dates, amounts, activities)
- Sales engagement tools (touches, meetings)
- Marketing automation (lead source, conversion path)
Who needs to be looking
CEO, CRO, Sales leaders, RevOps, Marketing leader
Decisions based on insights
- Coverage strong and quality strong: lean into higher-value deals, protect price, prioritize conversion over volume.
- Coverage strong but quality weak: your pipeline is a hallucination. Fix stage definitions, enforce exit criteria, retrain forecasting discipline.
- Coverage weak: go find demand fast. Increase outbound intensity, improve conversion paths, launch offers that shorten decision cycles.
5) CAC Payback Period (by motion)
Definition
How long it takes to recover the cost to acquire a customer from the gross profit generated by that customer. You need this by acquisition motion: inbound, outbound, partner, event-driven, community/referral.
Where the data comes from
- Marketing spend (paid, events, content costs)
- Sales costs (comp, tools, allocated overhead)
- CRM attribution (source, campaign)
Who needs to be looking
CEO, CFO, CRO, CMO, RevOps
Decisions based on insights
- Payback improving: invest more in the best motion. Increase volume without trashing quality.
- Payback worsening: stop scaling spend. Fix conversion rates, pricing, onboarding, and sales cycle. In multi-sided businesses, CAC often spikes because teams mix “brand events” with acquisition and call it performance marketing.
6) Sales Cycle Time (Median, not average)
Definition
Time from first meaningful buyer interaction to closed/won, measured as a median. Median tells you what normally happens. Average lies to your face.
Where the data comes from
- CRM timestamps (first meeting date, opportunity created date, close date)
- Sales engagement tools (first reply, booked meeting)
Who needs to be looking
CEO, CRO, sales leaders, RevOps, product marketing
Decisions based on insights
- Cycle time down: replicate the conditions. Tighten ICP, sharpen messaging, package outcomes, and remove friction from procurement.
- Cycle time up: investigate where deals stall. Fix enablement, pricing complexity, buyer confusion, legal/security bottlenecks, and weak next steps.
7) Forecast Accuracy (30/60/90)
Definition
How close your forecasted bookings/revenue are to actuals, over 30/60/90-day windows. This is operational maturity, not a finance trivia question.
Where the data comes from
- CRM forecast categories and commit/best case
- Sales activity and stage conversion trends
Who needs to be looking
CEO, CFO, CRO, RevOps, sales managers
Decisions based on insights
- Accuracy improving: you can invest confidently. You can hire, scale programs, and plan events without guessing.
- Accuracy poor: you have a governance problem. Tighten forecast calls. Enforce stage criteria. Align compensation and accountability. Forecasting is decision infrastructure.
8) Attach Rate of Expansion Products
Definition
The percent of customers who buy an add-on, upgrade, additional seat, premium tier, event pass, sponsorship upgrade, research add-on, or services bundle.
Where the data comes from
- Billing (multi-product invoices, add-ons)
- Customer Success tracking (expansion conversations)
- Product analytics (feature adoption for premium conversion)
Who needs to be looking
CEO, CRO, product leader, CS leader, RevOps
Decisions based on insights
- Attach rate up: your packaging works. Build “land and expand” plays. Standardize bundles.
- Attach rate down: expansion offer isn’t clear, isn’t valuable, or isn’t timed right. Fix the customer journey, build trigger-based plays, and tighten pricing architecture.
9) Utilization of High-Value Assets
Definition
For multi-sided models, your highest-value assets are usually audience segments, premium inventory, flagship events, high-intent moments, and relationship access. Utilization measures what percent of that premium asset capacity is monetized.
Where the data comes from
- Ad server/ad ops (inventory sold vs available)
- Event platform (sponsorship packages sold vs capacity, attendee segments)
- Community platform (engagement, member utilization, sponsor activation)
- Sales (inventory/product catalog utilization)
Who needs to be looking
CEO, CRO, Chief Product, Head of Events, Head of Audience/Community, finance
Decisions based on insights
- Utilization high: raise rates, add premium tiers, protect quality, and create scarcity intentionally.
- Utilization low: your go-to-market and packaging aren’t aligned to what buyers actually value. Repackage around outcomes. Fix segmentation. Improve distribution. Your premium assets can’t sit idle.
10) Decision Velocity
Definition
How long it takes your organization to go from insight to action to measurable result. This is the KPI behind every KPI. If your decision velocity is slow, every other metric deteriorates before you can respond.
Where the data comes from
- Operating cadence data (time from insight identified to decision logged)
- Project management tools (cycle times, blocked time)
- RevOps/BI (time to dashboard availability, time to root cause analysis)
- Post-mortems and weekly business reviews
Who needs to be looking
CEO, COO, CFO, CRO, functional leaders. This is a leadership team KPI.
Decisions based on insights
- Velocity improving: you can run more experiments, learn faster, and outmaneuver competitors.
- Velocity declining: you have process debt and misalignment. Tighten weekly operating rhythms. Reduce KPI sprawl. Clarify decision rights. In 2026, speed is not hustle. Speed is design.
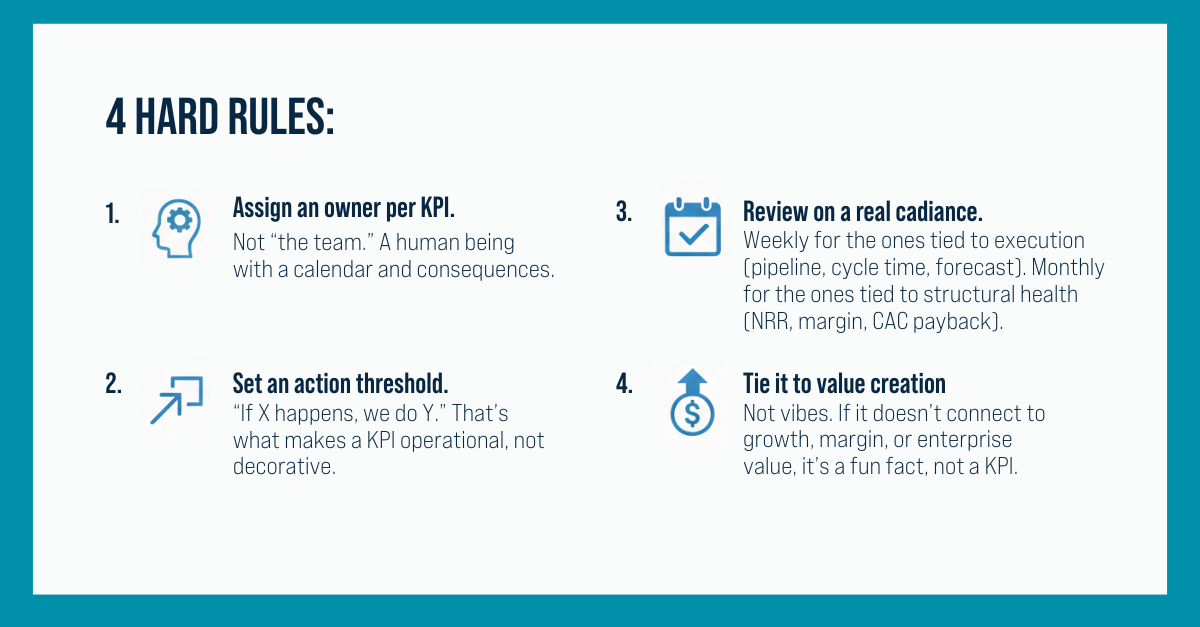
How to Actually Use This List (without turning your company into a KPI cult)
A few hard rules I recommend:
This is exactly why we’re so focused on playbooks and frameworks right now. Leaders don’t need more thought leadership. They need repeatable operating moves. That’s how you turn data into decisions, and decisions into profit.
Where KPI Mastery Meets Strategic Execution
For CEOs and revenue leaders, mastering these KPIs is just the start. The real challenge is pressure-testing them in real-time, seeing how they translate into action, and understanding how peers are solving the same problems across complex, multi-engine businesses. That’s exactly why we created RevvedUP 2026 and Revenue Room™ CXO. RevvedUP 2026 is a hands-on strategy lab where CEOs and C-suite leaders run scenarios, benchmark performance, and refine operating models under expert guidance. Revenue Room™ CXO continues the conversation year-round, offering a private peer community for executives to sharpen their thinking, compare governance decisions, and turn KPI insights into disciplined execution. Together, these forums give leaders the clarity, rigor, and community needed to transform insight into measurable enterprise value.
👉🏼Join RevvedUP 2026