Revenue
September 22, 2026
The Contraction Hiding Inside Your Renewal Rate

# Value Creation
# Revenue Growth
A customer who spends the same money two years running looks like retention. Measured properly, that flat renewal is often a contraction, and it usually surfaces after the window to act on it has closed.

Heather Holst-Knudsen
A customer spent $100,000 with you last year. They spent $100,000 with you again this year. The account shows as retained, the renewal rate holds, and nobody raises it in the pipeline review.
Widen the lens by one layer. Last year that $100,000 was exhibit space, a sponsorship, and a digital program. This year it is space and digital. The sponsorship is gone. The logo renewed. The relationship contracted.
Indiya Okam , Group Vice President of Sales at RX USA , put the arithmetic plainly on The Revenue Room™ Podcast :
"It's no longer 100 percent retention, it's more like 80 percent retention, because you have contraction there."
The dollars did not move. The customer's commitment did, and the measurement system never registered it.
Net revenue retention in an events or media business measures what an existing customer cohort spends this period against the prior period, with expansion, contraction, and churn each counted separately inside the number. A flat top line can contain all three at once.
Why This Is an Economic Problem, Not a Reporting Preference
Start with where the money sits. CEIR's 2026 Performance Benchmarking Playbook Series reports that exhibit sales account for roughly 60 percent of gross revenue across event sizes, and that exhibitor company retention runs at 73 percent for small shows, 78 percent for midsize events, and 69 percent for the largest exhibitions. Those figures are measured at the company level. They tell you the logo came back. They do not tell you what the logo stopped buying.
The same research found that only about 60 percent of organizers track exhibitor company retention at all, and that events consistently measuring retention, acquisition, Net Promoter Score, and feedback outperform peers on revenue, attendance, exhibitor participation, and profitability. The measurement gap is not cosmetic.
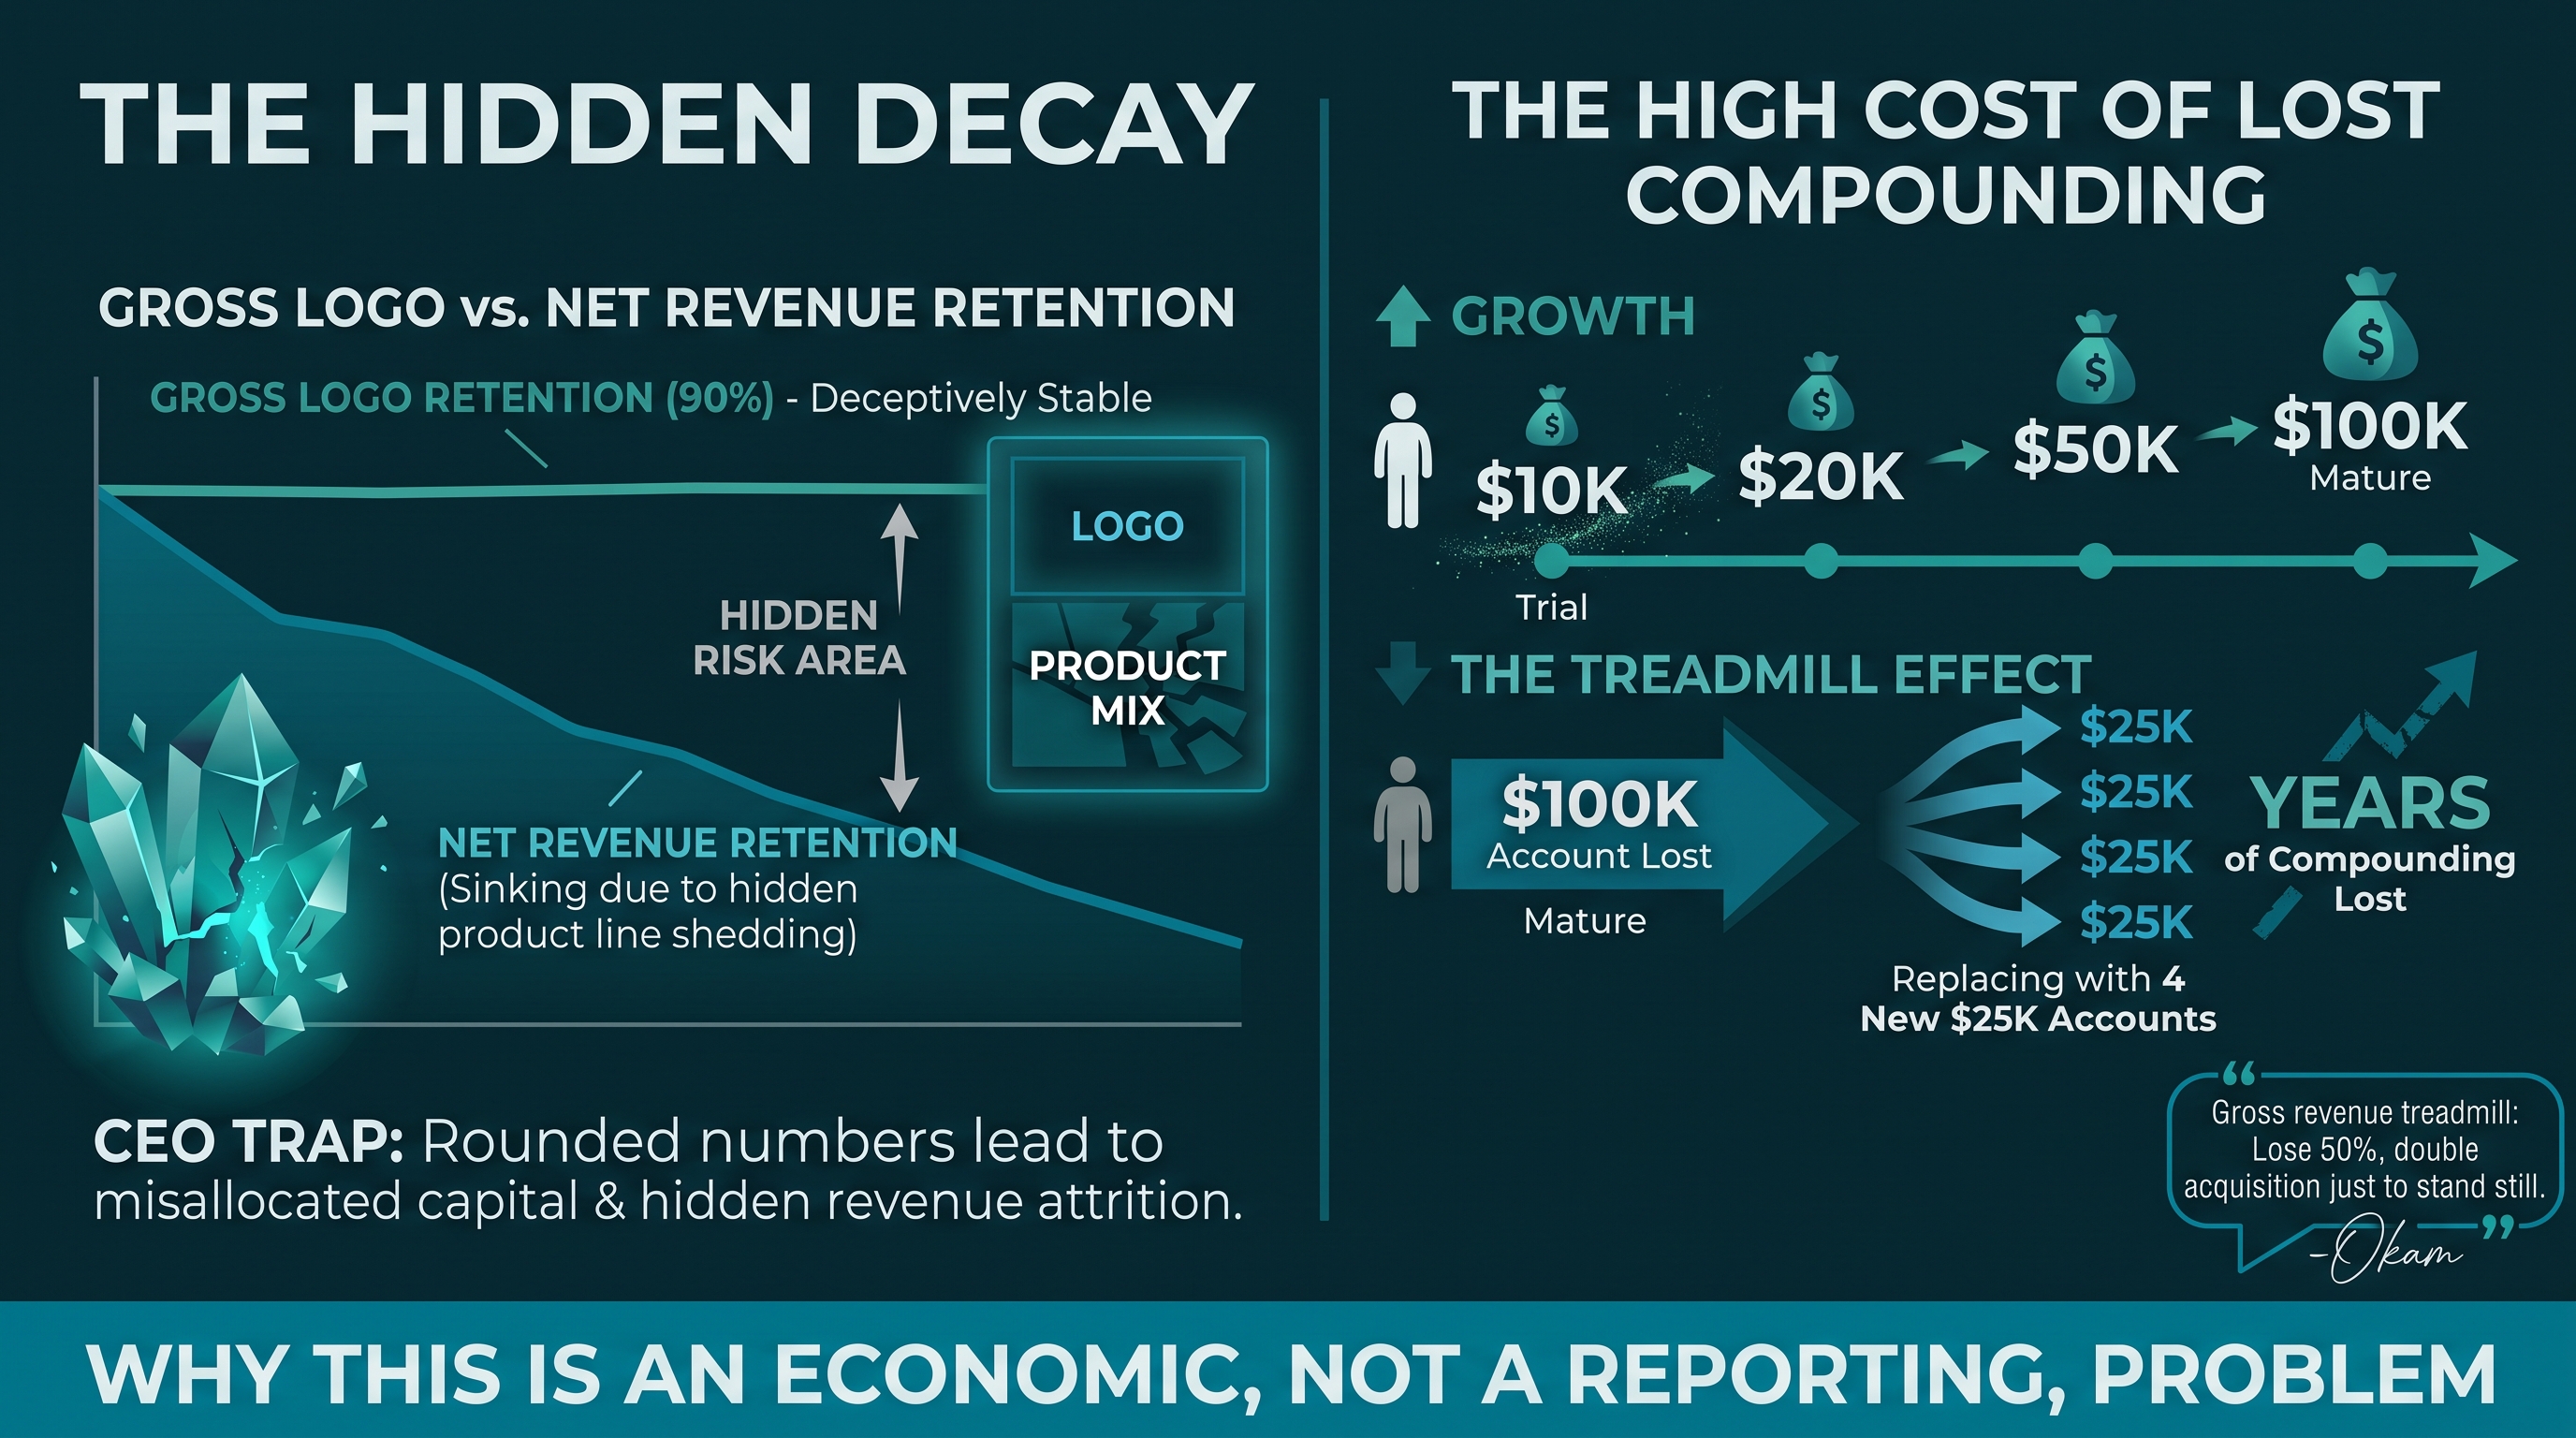
Now apply the second layer. If a portfolio holds 75 percent logo retention and a meaningful share of the surviving 75 percent has quietly shed a product line, the real net revenue retention number is materially lower than the reported one. Management is allocating capital, headcount, and sales capacity against a number the method itself rounded up.
Compare a market that has measured this for two decades. SaaS Capital's 2026 survey of more than 1,000 private SaaS companies put median net revenue retention at 103 percent for companies between $3 million and $20 million in ARR, with the 90th percentile at 117.9 percent. There, a 95 triggers a diligence conversation about product fit or go-to-market. In events and media, the same number is frequently reported as a solid year, because the mix was never decomposed.
Asked on the episode which business metric receives too much attention, Okam did not hesitate: gross revenue.
"Without knowing the product mix, margin profile and all those things, it might not be as good as you think."
There is a second cost, and it compounds. Okam described it as a treadmill: bring in 100 new customers, lose 50, and next year the acquisition target doubles just to stand still.
What makes that treadmill asymmetric is how accounts in this sector actually grow. A customer tries the event at $10,000 or $20,000, the experience lands, they send more people, and over a few cycles the 20 becomes 50 and the 50 becomes 100.
As I put it to Indiya on the episode, "if you lose that, it's not that you just have to replace that account. You have to replace it with lots of accounts, because you're not going to get the hundred K that you lost the first time." No first-year buyer walks in at $100,000. Losing a grown account costs you the years of compounding that produced the number, and it gets replaced at the bottom of the curve, several accounts at a time.
Why Flat Renewals Go Unnoticed
This is not a sales performance issue, and a better dashboard does not solve it. Four operating conditions produce it together.

The measurement layer is lagging by design. Most revenue dashboards report what was booked and whether the account came back. They rarely report the composition of that revenue. Okam described the shift her team is making toward product mix penetration as the North Star, precisely because the makeup of an account's spend tells you something the total never will. Product mix penetration measures how many of your revenue lines a given customer buys, and how that breadth is trending, rather than how much that customer spent in total.
Ownership of the renewal is ambiguous. Customer success in this sector has historically been scoped as fulfillment and project management rather than as a retention function with a revenue mandate. Okam's language is "activating customer success" as a retention engine: taking the documented customer objective from the seller, pulling it through delivery, and carrying it into the rebooking conversation. Where that handoff is informal, the objective is lost and the renewal conversation restarts from zero. A practical fix predates the term.
In consulting work I recommended that on any deal above $20,000, customer success joins the closing call or something very close to it, because the people responsible for activating the value should hear the customer state the objective rather than receive a summary of it afterward.
Organizational placement quietly caps account value. The change Okam is most proud of at RX Global is moving the sponsorship team from a production arm into a core selling arm, with a top 20 accounts rhythm that brings the sponsorship seller into the account conversation. The reported effect is incremental average customer value over time. Where sponsorship sits downstream of the sale, the cross-product conversation that would have caught the contraction never happens.
The selling calendar leaves no room to react. Events race to a finale, the sell-in window is short, and the signals that matter arrive before it opens. A customer who has not set up their exhibitor profile, who has stopped engaging with the portal, or who is registering business development managers this year where they sent C-suite last year is telling you something months ahead of the renewal. The preemptive conversation has to happen before the team is standing on the show floor.
Underneath all four sits pipeline discipline. Okam made pipeline health one of five focus areas at RX Global and was explicit that the work was not about compliance. "Pipeline is not just a story or not just an administrative task. It is what sustains the business." A pipeline carrying product mix and engagement signal is an asset to the seller. One carrying close dates only is a chore.
Five Management Moves
Decompose the renewal before you call it one. Calculate net revenue retention at the account level with expansion, contraction, and churn as separate lines, then roll it up by event, portfolio, channel, and parent company. A single blended number hides the pattern. Retaining the logo is not the same as retaining the revenue.
Make product mix penetration a reported metric, not an analysis project. Gross revenue and logo retention stay on the report. Add the composition of spend per account and the direction it is moving. This is the measure that turns a flat renewal into a flagged account.
Give customer success a revenue mandate and a written handback rule. Define the engagement signals that constitute churn risk, the point at which the relationship returns to the seller who owns it, and what the seller is expected to do on receipt. Okam's framing is a baton pass with complete information, not a transfer of the file. The rule should be evidentiary rather than calendar-driven: let the data tell us where customer success continues, and when customer success brings the salesperson back into the loop.
Move sponsorship into the selling arm on named accounts. Pick the top accounts per event, bring the sponsorship seller into the account conversation, and measure average customer value on those accounts against the rest of the book. The mechanism is broader discovery, not a harder cross-sell.
Pick one thing and lead with the why. Okam's advice for leaders facing fragmented data, long-standing habits, and multiple revenue streams was to narrow it to one focus area and articulate the business reason behind it before asking for behavior change. The clarity she described is specific: what we are looking to do, what it means to be successful now, which tools we will operate with, and why. Get that said out loud, she argued, and "you now get the people who buy in naturally."
A 90-Day Focus Plan
Days 1 to 30.
Recalculate last cycle's retention for your top 50 accounts at the line-item level, counting contraction and expansion separately, and name one executive owner for the number. Expect the figure to differ from the reported one, and treat the size of that gap as the finding.
Days 31 to 60.
Agree written definitions of expansion, contraction, and churn that finance, sales, and customer success will all use. Identify three to five pre-event engagement signals available in systems you already have, and set the handback trigger between customer success and sales.
Days 61 to 90.
Run the co-selling motion on one event's top accounts and establish the company-specific baseline for product mix penetration. Recheck the recalculated retention number at the next renewal cycle, and monitor whether flagged accounts are being worked earlier rather than at the show.
Questions for the Leadership Team
- When we say an account renewed, what exactly did we measure, and does that measure count contraction inside the account?
- What is our net revenue retention by event, by portfolio, and by parent company, and how far apart are those numbers?
- Who owns the renewal between the close and the rebooking, and at what documented signal does it return to sales?
- Which engagement signals do we already hold that would flag churn risk 90 days before the event, and is anyone acting on them?
- Where does our sponsorship capability sit in the organization, and what is it costing us in average customer value?
The Larger Prize
The same data that exposes contraction has a second use. Okam described a project examining what RX's sponsorship assets are actually worth inside the ecosystem, and the finding that consolidated engagement across the portfolio was larger than expected. Her thesis is whether that engagement data constitutes a distinct revenue stream, approached the way a media company would approach it.
That is the compounding logic. Engagement data improves the retention signal, a better signal improves the customer conversation, a better conversation deepens participation, and deeper participation produces richer data. Each turn strengthens the next. A portfolio that merely contains exhibitions, digital, and sponsorship does not compound. A platform where those assets feed one another does.
The measurement discipline is the entry fee. You cannot monetize engagement intelligence you are not yet using to protect the revenue you already have.
Listen to the full conversation with Indiya Okam on The Revenue Room™ Podcast. Then take the question inside Revenue Room™ CXO , the invite-only executive peer network and year-round decision system where CEOs and their revenue-critical teams pressure-test this class of decision. The Revenue Leakage Scorecard within the Growth Readiness Profile is built to surface where retention and expansion are being lost, and the Growth Room and CEO Boardroom exchanges are where members work out what to do about it.
Net revenue retention is also on the agenda at RevvedUP 2027 , March 14 to 16 at The Vinoy in St. Petersburg, Florida, where 250 CEOs and revenue-critical CXOs convene around AI, Data and the New Race for Enterprise Value. If flat renewals are hiding contraction in your portfolio, that is the room to bring the question to.
Sign in or Join the community
The Nexus for Data-Driven Growth Leaders

Create an account
The Nexus for Data-Driven Growth Leaders
Like
Comments (0)
Popular

Dive in
Related
Blog
The CEO Playbook Hidden Inside Jessica Sibley’s TIME Reinvention
By Heather Holst-Knudse... • May 19th, 2026 • Views 67
47:33
Video
From Fragmented Events to Category Powerhouses: Inside Hyve’s Growth Engine
By Heather Holst-Knudse... • Feb 5th, 2026 • Views 72
Blog
The Visionary's Playbook: Inside Philip Thomas's £1.6B Events Industry Revolution
By Heather Holst-Knudse... • Feb 6th, 2025 • Views 39
Blog
Inside the Revenue Room™ Salon: A Night of Vision, Connection, and Celebration
By Heather Holst-Knudse... • Oct 17th, 2025 • Views 80
Blog
The CEO Playbook Hidden Inside Jessica Sibley’s TIME Reinvention
By Heather Holst-Knudse... • May 19th, 2026 • Views 67
Blog
The Visionary's Playbook: Inside Philip Thomas's £1.6B Events Industry Revolution
By Heather Holst-Knudse... • Feb 6th, 2025 • Views 39
Blog
Inside the Revenue Room™ Salon: A Night of Vision, Connection, and Celebration
By Heather Holst-Knudse... • Oct 17th, 2025 • Views 80
47:33
Video
From Fragmented Events to Category Powerhouses: Inside Hyve’s Growth Engine
By Heather Holst-Knudse... • Feb 5th, 2026 • Views 72