Most media businesses can tell you their pageviews or open rates. Almost none can tell you their audience revenue per user across all monetization streams. Which acquisition channels produce subscribers that actually engage? What engagement signals in the first 90 days predict whether a reader becomes a paying subscriber, a sponsor-worthy impression, or just a bounce?
That gap is where revenue leaks. And it's wider than most publishers realize.
Why Traditional Media Metrics Fail
The metrics most publishers rely on (pageviews, unique visitors, open rates, subscriber count) were designed for a single-stream business. But modern media monetization is multi-stream: sponsorships, programmatic advertising, paid subscriptions, events, and first-party data licensing all run simultaneously. A single audience member might generate value through newsletter opens, site visits, event attendance, and eventually a paid subscription.
When you measure each stream in isolation, you see fragments. When you measure the audience member across streams, you see economics. That shift, from content metrics to audience economics, is what separates publishers who grow sustainably from those running on vanity dashboards.
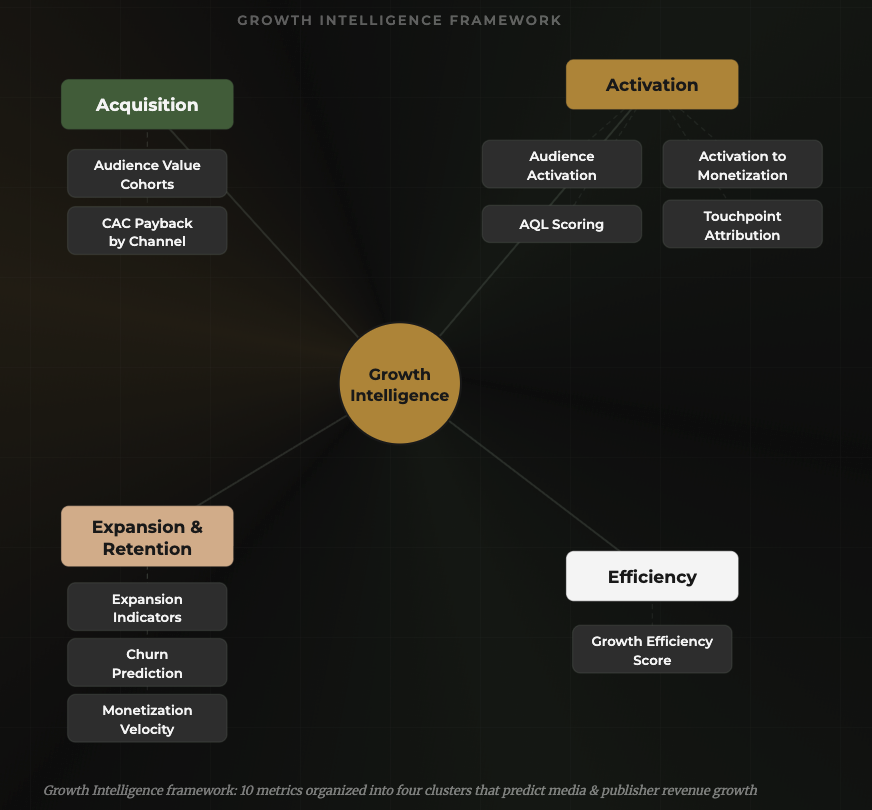
The Growth Intelligence Framework: 4 Clusters, 10 Metrics
These are the 10 metrics we build for every media and publisher client, organized into four clusters across the audience revenue lifecycle:
Acquisition Economics — What's an audience member actually worth, and what did it cost to get them?
- Audience Value Cohorts: Multi-stream revenue per user segmented by acquisition source, content affinity, and engagement tier. Actual economic value, not just subscriber count.
- CAC Payback by Channel: How fast does each acquisition channel earn back its spend? Community-sourced members might cost ~$500 to acquire. Event-sourced could cost $37K. Without this, you're guessing where to spend.
Activation Economics — Which readers become paying, engaged audience members?
- Audience Activation: The percentage of new audience members who hit meaningful engagement milestones. Not just "opened an email," but real activation like event attendance, paid conversion, or sponsor content engagement.
- Activation to Monetization: The conversion rate from activated audience to revenue-generating behavior.
- AQL Scoring (Audience Qualified Lead): A composite score predicting which audience members will convert to higher-value tiers. Lead scoring, but for audience monetization.
- Touchpoint Attribution: Which content, channels, and sequences drive activation? Multi-touch attribution across the audience journey, not just last-click.
Expansion & Retention — Who's growing in value, who's leaving, and can you intervene before it shows in revenue?
- Expansion Indicators: Signals that an audience member is moving up: more events, premium content engagement, peer referrals. The leading indicators of revenue expansion.
- Churn Prediction: Engagement decay patterns that predict churn 30–90 days before it hits. The earlier you see it, the wider your intervention window.
- Monetization Velocity: How fast does an audience member move from first touch to revenue? Slow velocity signals funnel friction. Fast velocity signals product-market fit.
Efficiency Metrics — Is your growth efficient, or just expensive?
- Growth Efficiency Score: (New Revenue + Expansion Revenue) / Total Growth Investment. Below 1.0 means you're burning. Above 2.0 means you're compounding.
The Framework Applies Across the Media Spectrum
Whether you're a newsletter-first publisher, a content company running programmatic and direct-sold advertising, an events and membership business, or a hybrid model, the 10 metrics apply. The benchmarks differ by archetype, but the measurement architecture is the same.
Start Measuring What Matters
If you want to assess which of these metrics your data can already support, and which gaps are costing you revenue, book a measurement sprint.